ColTapp includes various ways to quantify image based color, shape and plate density metrics. Most of these metrics are directly calculated when executing the data export, according to the user wishes, apart from the Voronoi cell areas which need to be calculated prior export, from the Detect tab (Voronoi caluclation button) and can be visualized on the displayed images. Note that the other metrics are recalculated by the program at each export, and this can be lengthy for large images or high colony numbers.
Shape and color
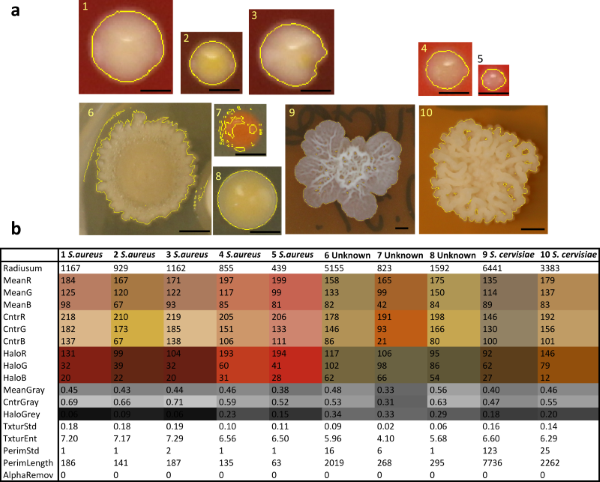
Colony color or roughness may be a good starting point for automatically assigning colonies to categories, e.g. species.
RGB color and Grayscale value are pixel intensity values based on the original image. They can be exported as a mean over the whole colony area or as the center value, which is taken as the average a 5 pxl radius circle around the colony center. The “Center” value will be calculated for pixels outside the colony border, should the colony radius be under 5 pxl. The calculation is the same if colonies are touching or not, and is based on the detected radius regardless of the colony area.
Texture metrics propose to use image entropy or standard deviation of pixel intensities as a proxy for surface roughness (Simunovic, G. et al. Surface roughness assessing based on digital image features. Advances in Production Engineering & Management 11, 93 (2016)). Image entropy calculation is performed with the Entropy function of MATLAB, and is a measure of randomness to characterize the texture of the colony. It is defined as -∑(p.*log2(p)) where p contains the histogram counts of the image. The calculation for standard deviation and entropy is the same if colonies are touching or not, and is based on the detected radius regardless of the colony area.
Perimeter tries to estimate colony perimeter based on a automatic binarisation of colony contour made at a local scale. The automatic binarisation is based on subsampling of the image around the colony as defined by a square zone around its center, with square side being 15% larger than the colony radius (or last colony radius in timelapses). The standard deviation of the perimeter is based as the distance to the perfect circle designed by the accepted colony radius for each pixel in the automatically detected perimeter. Both length and standard deviation thus depends on image resolution. Note that edges detected that are further than 1.1 colony radius from the center of the colony will not be taken into account.
Halo color can be exported as pixel intensity values for a band around the colony calculated either based on a fixed number of pixels or as a mutltiple of colony radius (“halo until distance”). This is typically to measure hemolysis or usefull in colorimetric assays. It can export either RGB values or grayscale image value.
Some examples of different colony morphologies and colors and the derived measurements (Part of Supplementary Fig. S4 of publication)
=> Note on colonies with rejoining borders:
Colonies touching each other will strongly affect perimeter and halo measurments. For this reason, the program excludes merging zones from perimeter and halo calculations. It further exports the sum of the estimated arc length (degrees) for touching colonies (“AlphaRemov” in export file). This sum can be greater than 360° if touching colonies have common merging arcs due to their large radius.
Density metrics
As described in original article for the software presentation, those are values based on colony proximity. The user can set a radius cutoff for metrics that strictly depend on distance to all colonies, so that colonies further than this radius cutoff will not be taken into consideration for the calculation.
For example, should 4 colonies be on a plate, with 3 colonies at distance 1, 2, 4 to the focal colony, ∑1/D would be 1+1/2+1/4=1.75 for an infinite cutoff, while it would be 1+1/2=1.5 if the cutoff is set to be below a distance of 4. Note that this radius cutoff can be handy in crowded plates when the user knows the diffusion constants of signalling molecules and the time for which it can have diffused.
The angular diameter is calculated as 𝐴D = ∑ 2*arctan(Ri/Di)
where Ri and Di are the radius and distance from the focal colony of each neighboring colony. This metric will thus assume bigger colonies have a larger influence on focal colonies than their smaller counterparts.
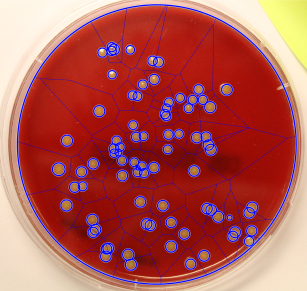
The Voronoi area is not sensitive to the radius cutoff, but is sensitive to a proper plate border definition. Voronoi cell areas describe the total space on an agar plate available to each colony, obtained by tracing perpendicular bisector lines between each pair of neighboring colonies. For the Voronoi calculation to work properly, it is important that a circular (plate) area of interest (AOI) is defined.
The blue edges show the calculated Voronoi cell areas. The visualization of these can be activated from the Options window