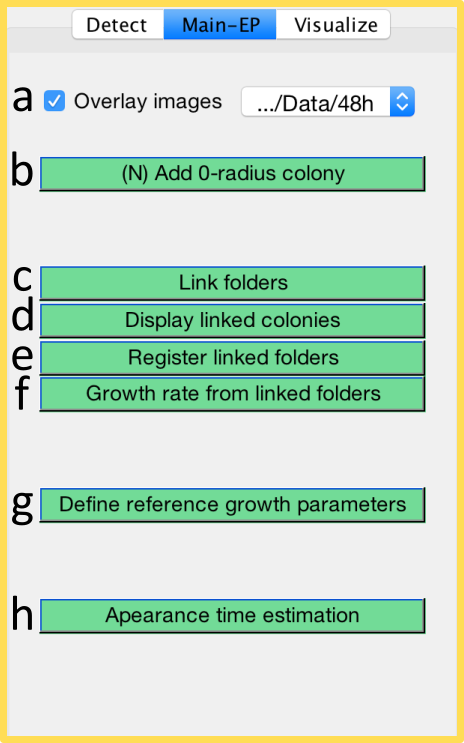
Functions specific for endpoint image analysis can be found in the Main-EP tab.
Some very late appearing colonies may not be observed at the optimal time for colony size observation (e.g. 24h). In that case, we suggest capturing image(s) at later timepoint(s) (e.g. 48h). ColTapp allows the user to overlay images (tickbox a) taken from the same plate at different times to ease detection of very late growing colonies which did not yet appear at an earlier timepoint. ColTapp assumes that a folder under analysis contains multiple images from the same timepoint and requires the user, upon the first engangement of the Overlay tickbox, to navigate to a folder containing the same set of images with matching order, acquired at another timepoint. If multiple folders are linked (see below), the image folder for the overlay can be selected with the dropdown-menu (a). The colonies visible on later timepoint but not on the currently loaded main folder can be marked as colonies with a radius of 0 pixel (Button b or shortcut n).
To achieve similar image orientation at both timepoints during photography, the user may place a mark on the edge of the plate as reference. Users can manually align images which have not been captured in the exact same orientation by clicking at two matching positions on the images of the two (or more) timepoints (Button e). The inbuilt MATLAB function fitgeotrans is used to fit a geometric transformation to the pairs of points with a nonreflective similarity to estimate rotation and translation of the two images to align.
In some laboratories, setting-up high-throughput time-lapse imaging might not be possible, thus ColTapp proposes to estimate colony growth rate and/or lag time from endpoint images. This is possible because when bacterial cells with a lag resume growth, they rapidly reach their maximal replication rate and the resulting colonies have linear radial growth rates similar to those of colonies emerging from cells with no lag. Therefore, a reference linear radial growth rate (GR, button g) can be used to estimate the colony appearance time tapp (Button h) based on colony radius R at a given timepoint (tf) by means of a linear extrapolation:
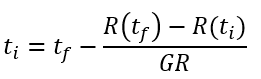
with Rthresh defining the radius (R) at time ti = tapp. Rthresh is set to 200um per default. Note that using a linear extrapolation with a reference growth rate to estimate the appearance time has two strong assumptions: first, that all colonies are still in the linear phase of their growth and second, that they all have the same linear radial growth rate. To account for these differences and substitute a missing time-lapse setting, ColTapp has functionalities to estimate per-colony growth rates from a minimum of 2 images of the same plate at different timepoints.
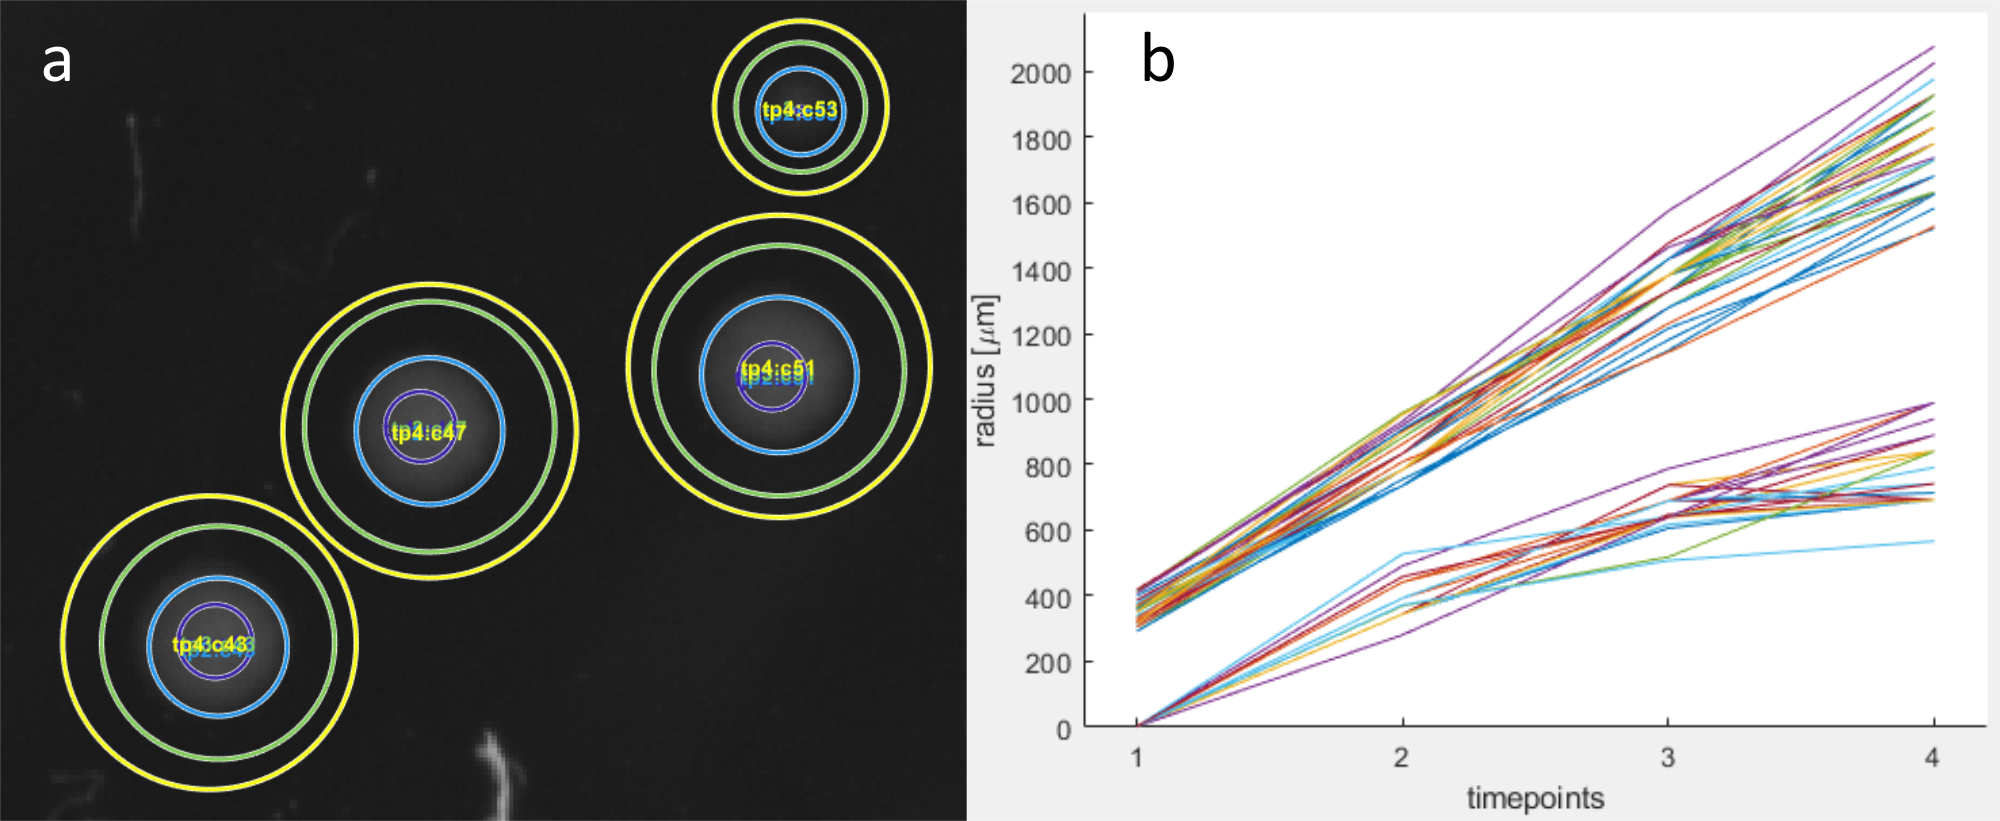
The user can link corresponding folders of multiple image sets taken at different timepoints to create timeseries data without the need for a time-lapse imaging setup. ColTapp requires that all image-folders are analysed, i.e. all colonies are detected and a spatial calibration factor for each image is stored. Additionally, the number of detected colonies on a given image should be the same to avoid position matching problems. Colonies on the images in different folders are matched based on the minimal distance of centers between colonies. Upon clicking on button c, the user is asked to select all folders containing the different timepoints. Mismatches can be corrected by aligning the images at different timepoints by fitting a geometric transformation to user-defined pairs of points with a nonreflective similarity to estimate rotation and translation of the two images to align (button e). As a control-function, the circles of all colonies between different folders can be displayed on the current image (Button d). The user then can visually inspect if all circles are aligned and if displayed numbers match (image a below). Radial growth curves can be displayed from the Visualize tab with the Radius vs Time button (image b below).
ColTapp computes the slope between colonies’ radii at different timepoints (same equation as for apearance time estimation, see above) which results in an individual colony radial growth rate GRcol for each time interval between linked folders. These growth rate values can subsequently be used for appearance time estimation to substitute the reference growth rate.