The default parameters of each functionality of ColTapp can be adjusted by the user within the Options. The Options also include various auxiliary functions.
The Options window is divided into four tabs : Global, Detect, Main (TL or EP) and Visualize. The latter tabs regroup parameters corresponding to each of the main panels’ corresponding tab, the first tab, Global (left on the following figure), regroups all parameters which apply globally, whatever the analysis step.
Global
Color to grayscale method selection
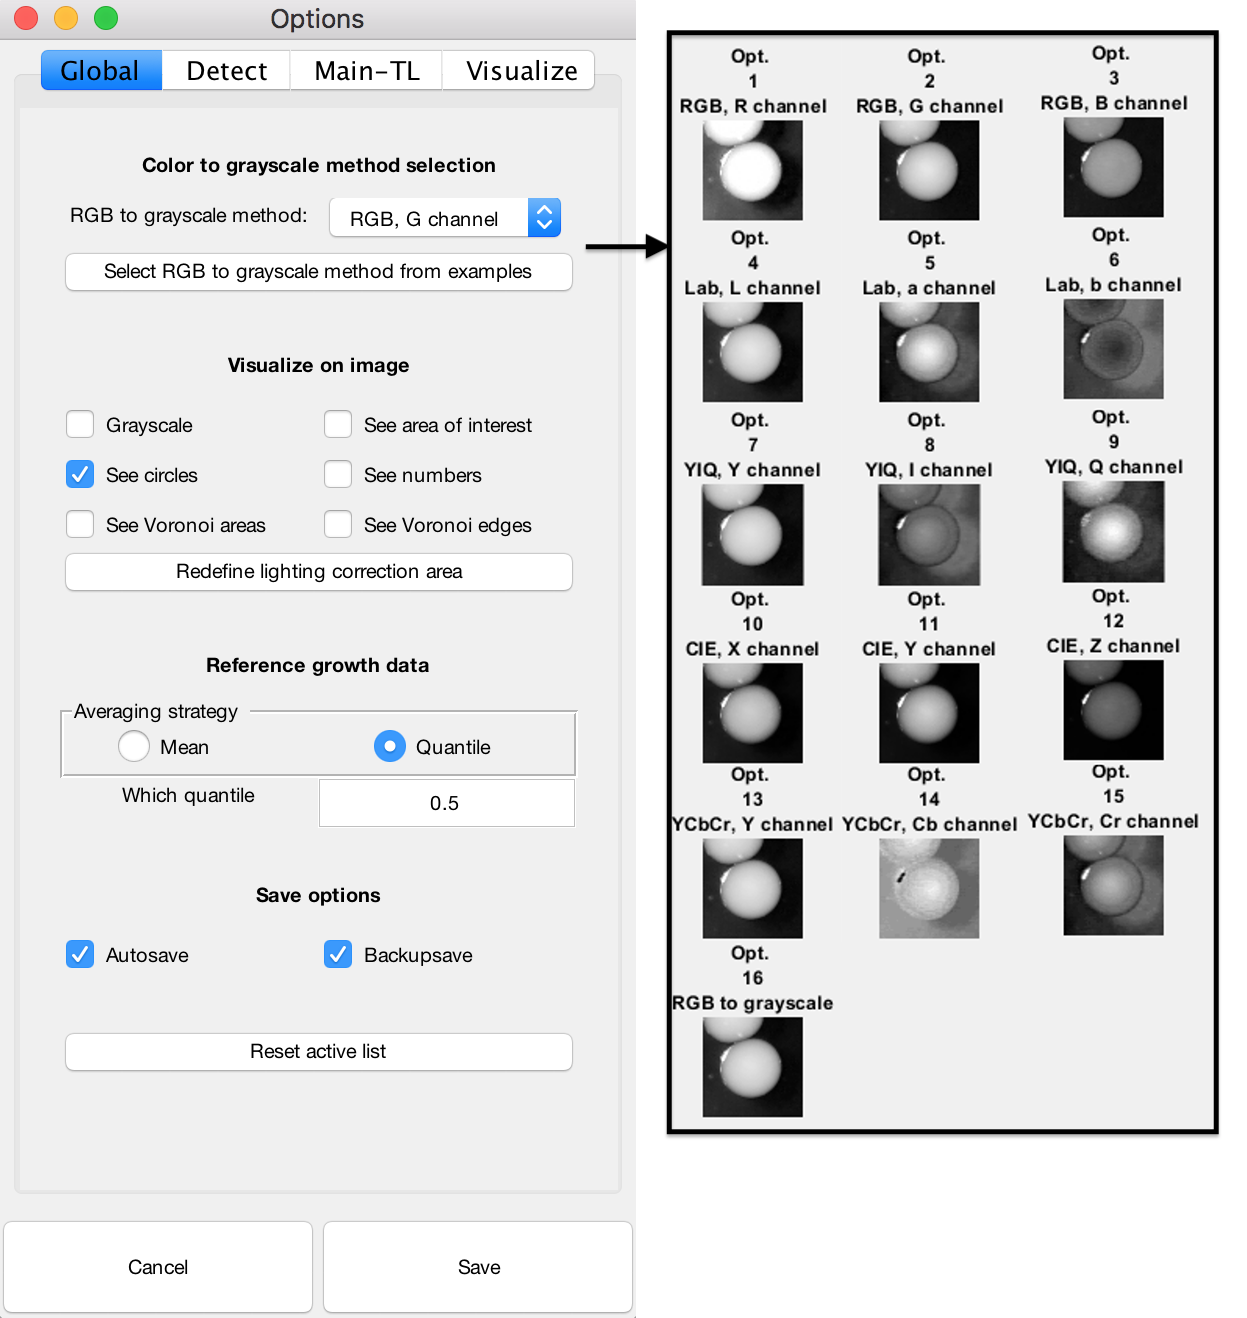
Colored RGB images are transformed into grayscale images for many image analysis steps (colony detection, colony kymograph derivation from time-lapse images). ColTapp offers 16 different methods for grayscale conversion.
Using one of the three RGB channels is computationally quick and generally precise enough, but in some special cases, the user may want to use a different conversion, as for example a transformation to other classical color spaces (e.g. CIELAB) and using one of the generated channels. The inbuilt MATLAB function rgb2gray which uses a weighted image conversion, retaining information of all three color channels, is also available. With “Select RGB to grayscale method from examples” the user may visualize the result of each different method (as shown in the right panel of the following Figure) and select the most appropriate method.
Global tab of the Options (Part of Fig. S2 of the publication) and grayscale conversion methods
Visualize on image
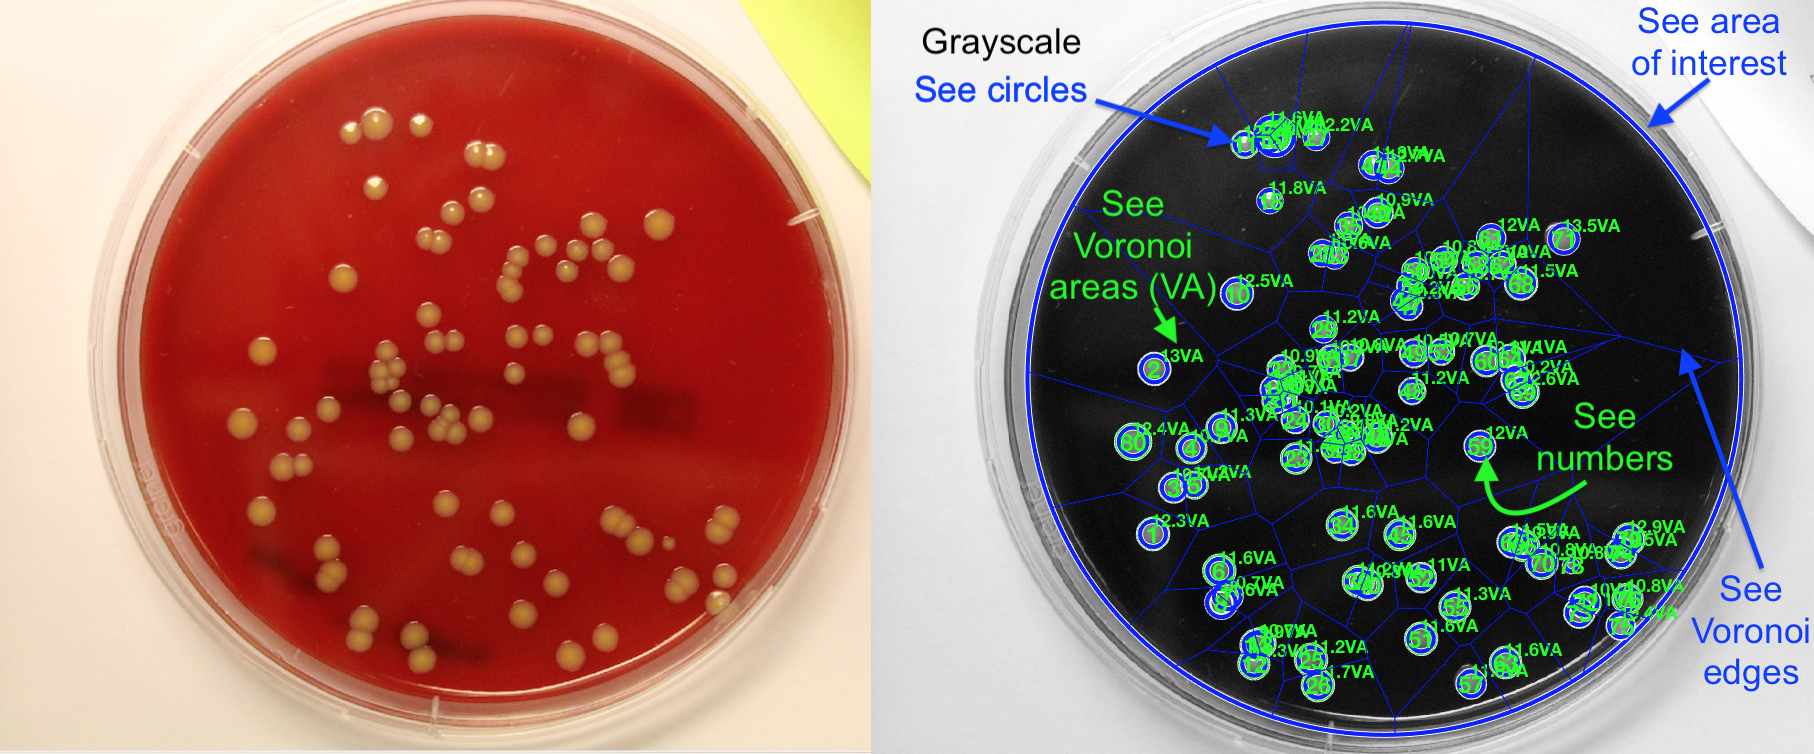
The user can use toggles to chose which data should be visualized directly on the images in the main panel.
Visualization on main panel image
The Redefine lighting correction area button allows a user to chose a new subset of the image as input to the lighting correction algorithm.
Reference growth data
When extracted automatically from an analyzed control experiment, the reference appearance time of that experiment is
averaged using the mean, by default. Yet, users concerned by the presence of outliers in the growth control experiment may chose to use the median (or any user-defined quantile) via this tab.
Save options
Autosave, back-up save
Reset active list
ColTapp allows to group colonies into lists to use certain downstream functions only on the indicated subset of colonies. User can remove all colonies from the active list on the main panel with this button.
Detect
Image preprocessing
Image binarization method can be set by the user. The default uses Adaptive thresholding. This option generally works well even for slightly inhomogenous lighting conditions but is a bit slower than the basic Global binarization which utilizes one threshold value (Otsu’s method). If the user utilizes already binarized images, the binarization step can be omitted by setting the binarization method to none.
Higher values of Binarization sensitivity leads to higher amount of foreground classification. The default value works well with white/yellow colonies on blood agar but is also good enough to binarize the image reliable if regular agar is used.
By default, colonies (circles) are considered to be lighter than the dark agar background. This can be inverted with the tickbox Dark colonies on bright background. We found this especially useful for detection of phage plaques on a bacterial lawn.
Colony detection parameters
The Circle detection mode (Regionprops or direct) (default: Regionprops). Circle detection can be operated in two modes: Regionprops mode utilizes a multi-step process to find first isolated foreground objects (colonies) and then applies circle detection methods only on subparts of the images containing isolated objects. The direct mode directly searches for colonies on the entire image. Regionprops mode is expected to be more accurate in cases with many touching colonies and usually is slightly faster.
The imfindcircle sensitivity (default:0.94). For both modes. This value determines the sensitivity for finding circles. Higher values let weaker circles pass and helps finding less prominent (lower contrast from colony to agar) but also leads to more false positive circles.
The Minimal Radius (default:20 pixels). For both modes. Minimal radius of circle search range, utilized by the MATLAB function imfindcircles. This parameter is crucial to set correctly.
The Maximal Radius (default:65 pixels). For both modes. Maximal radius of circle search range, utilized by the MATLAB function imfindcircles. This parameter is crucial to set correctly.
The Scale bounding box (default:1.35). For regionprops mode only. After the isolated objects are identified, sub-images cropped around the object are used for further processing. The size of the cropped rectangle is scaled with the Scale bounding box factor.
The Min distance from border (default:10 pixels). For regionprops mode only. After the sub-images are generated, circles are detected within. Min distance from border defines the minimal distance of the circle centers from the border of this sub-image.
The Foreground bias (default:0.17). For regionprops mode only. To check if detected circles are considered as foreground, the sub-image is binarized (Otsu’s method). The Foreground bias is subtracted from the automatically generated threshold to classify more pixels as foreground.
The Min area foreground (default:0.7). For regionprops mode only. After a binarized sub-image is generated, ColTapp checks if the proportion of pixels classified as foreground exceeds the Min area foreground value. Circles with lower proportion are discarded.
The Max overlap (2 circles) (default:0.9). For regionprops mode only. If more than one circle is detected on a subimage, ColTapp checks the amount of overlap of these circles. If a circle overlapps with another circle for more than Max overlap of its own area, the circle quality (from the MATLAB function imfindcircles) is compared and only the circle with higher quality is kept.
The Min rad difference (default:10 pixels). For regionprops mode only. If more than one circle is remaining, the center distance is calculated. If the distance is smaller than Min center distance and the radius difference between the two circles is less than Min rad difference the cirlce with the lower quality is discarded.
The Min center distance (default:20 pixels) For regionprops mode only. If more than one circle is remaining, the center distance is calculated. If the distance is smaller than Min center distance and the radius difference between the two circles is less than Min rad difference the cirlce with the lower quality is discarded.
The Max total overlap (default:0.95). For regionprops mode only. The area of each circle overlapping with any other circle is calculated. If the proportion of pixels classified as overlapping is higher than Max total overlap, this circle is discarded.
The Start iterative overlap is the proportion (default:0.8). For regionprops mode only. Final step in the regionprops mode. If there are still more than one circle passing all quality control steps, the total overlap proportion is compared with Start iterative overlap. Cirlces that have higher proportion of overlapping area are discarded. If no circle passed this check, the threshold is increased until at least one circle passes this control step.
The Final min center distance (default:2 pixels). For both modes. After all circles have been detected, the distance between all centers is calculated and circles are discarded based on the circle quality if two circle centers are closer to each other than Final min center distance.
Main-TL
Define radii-tracking parameters
The Reference frame, on which colonies are found and from which the radii are tracked on the other frames, is set to the last frame of the time-lapse by default.
The Time interval between frames of a time-lapse serie is automatically detected upon import and if this automatical detection fails, the user is asked to define it.
The Registration factor (κ) defines the subpixels resolution (1/κ) at which the image registration algorithm performs a 2-D rigid translation (default: 100)
The Kymograph threshold shift (default:0.17)
The Scale radius for overlap factor (default: 1) is multiplied to the radius of the focal colony from which [neighboring colonies are tested for overlap] (https://coltapp.github.io/timelapse.html). By increasing it (>1), ranges of angles corresponding not only to overlapping colonies but also very close colonies will be discarded from the kymograph creation process. Note that this increase might lead to high proportions of angles to be discarded. Decreasing the scaling factor (<1) leads to reduced ranges of excluded angles. This might be useful in densely populated plates to still achieve some overlap exclusion to increase quality of kymographs at earlier timepoints. Note that if more than 90% of all angles are discarded because of overlap, the exclusion of angles is omitted completely, to avoid reducing the available data too much.
This overlap detection functionality can be completely removed by the user by ticking the overlap exclusion tickbox.
The images can be transformed with the lighting correction algorithm in the Detect tab . The resulting enhanced images are typically meant to improve visualization for the user, and by default not used downstream for image analysis. However, a user can tick the box Use enhance images if willing to use these transformed images as input for the Radii tracking algorithm.
Define appearance time parameters
The Apperance time threshold mode defines the unit of the threshold a colony radius should reach for the colony to be macroscopically detectable. (default: micrometers)
The Detection threshold radius defines the value of the threshold a colony radius should reach for the colony to be macroscopically detectable. (default: 200)
The Number of frames for fit defines the number of frames starting from the first frame a colony radius is bigger than the detection threshold utilized for linear extrapolation to determine appearance time (default: 50).
Additional possibilities
Process timelapse subset allows the user to define combined subsets of colonies and frames to re-run the time-lapse processing algorithm.
Manually process timelapse is a function which presents to the user a series of sub-images of colonies (user-defined subset of colonies and frames) and the user can draw the colony circle manually. This can be utilized of for certain frames ColTapp failed to detect a correct radius due to image artifacts.
Recalculate kymograph radius is a failsafe function. If by any kind of weird mistake all radius data gets deleted but the kymographs are still present, the radial growth curves can be recalculated with this button.
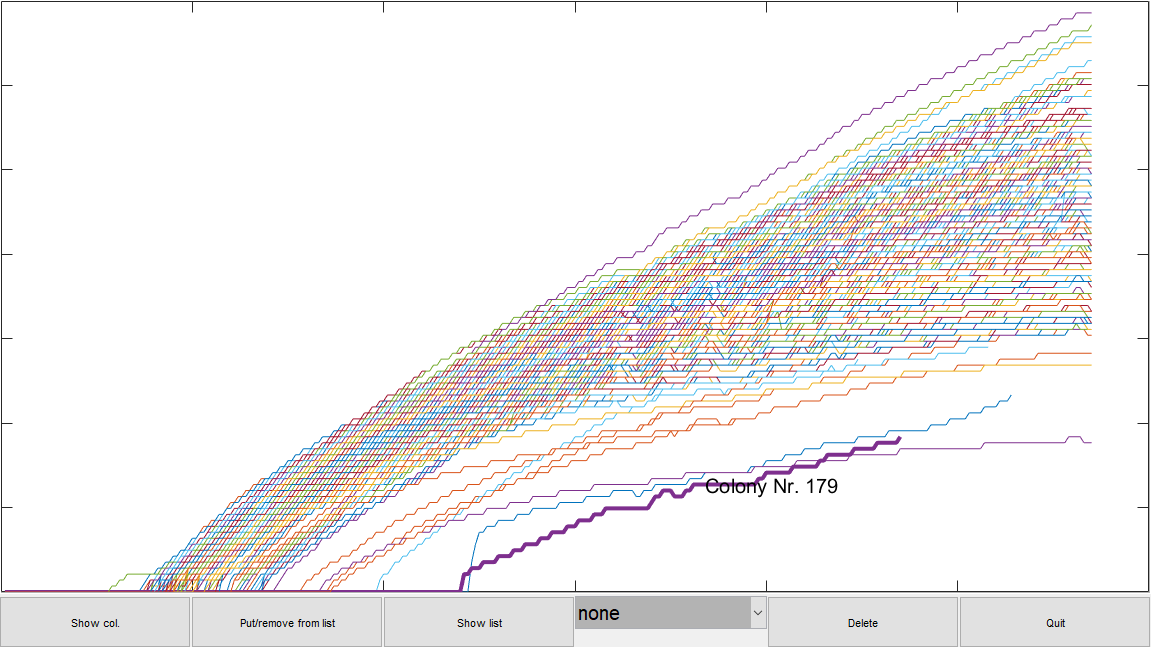
Select curves to delete opens a small extra GUI showing the radial growth curve for each colony. A user can click on a line and then click the Show col. button to display the Colony number. This is helpful to identify the colony for which the time-lapse processing failed and corrections (for example to the center) are needed before re-running this colony with the Process timelapse subset button. If the selected radial growth curve cannot be corrected, it can be deleted from the dataset with the Delete button. Be aware, this button only replaces all data within the radial growth curve data with NaN values while retaining the colony information. Additional buttons to display user-lists and adding/removing colonies to lists are also inbuilt in this mini-GUI.
The mini-GUI opened by the Select curves to delete button.
Restore deleted curves recovers radial growth curve data for colonies deleted with the Select curves to delete.
Reset registration is helpful if the user-defined rectangle for image registration was suboptimal and needs to be drawn anew.
Delete radius data of selected frames is a function that lets a user replace the radius data of all colonies at a user-defined frame(s) with NaN values. This can be helpful if there are lighting artifacts at certain timepoints within a time-lapse.
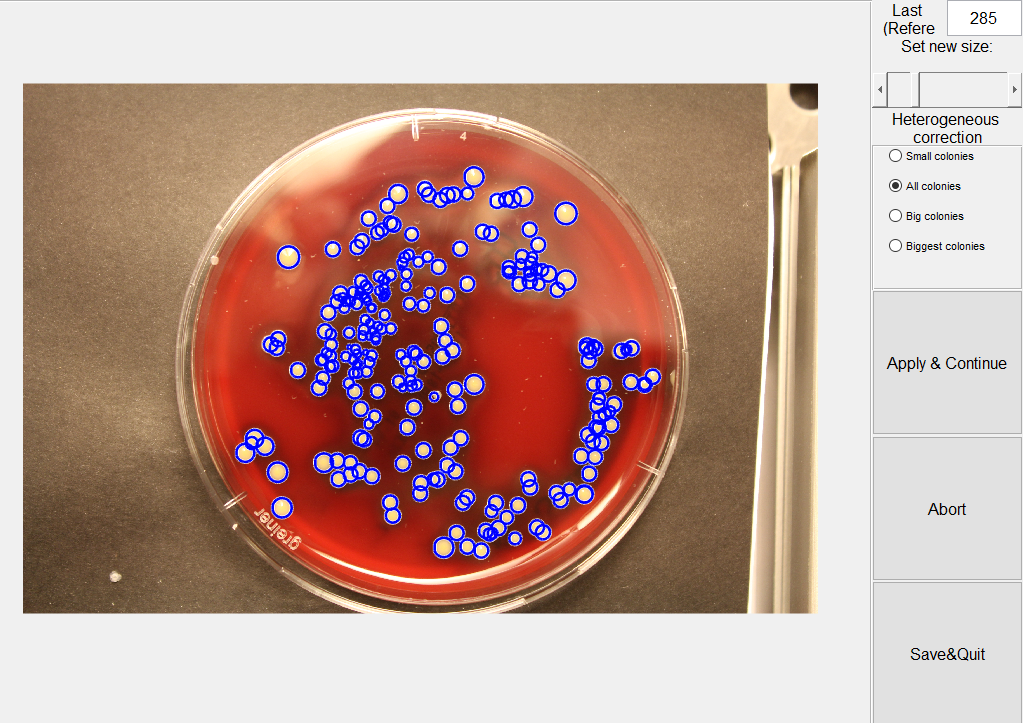
Scale detected radius opens a mini-GUI to scale initially detected radii. This function allows to increase/decrease the colony radius defined by the initial Find colonies button within the Detect tab. The scaling factor can be adjusted by the slider on the top right. The number displayed in the Last frame (Reference) field is the frame displayed. The user can select to scale only a subset of colonies based on their size (based on quantiles). For example, only the smallest few colonies can be scaled to have a bigger radius.
A given use-case can be: Detecting colonies not on the last but an earlier frame.
A reason could be that the colonies merge and touch on the last frame which makes colony detection more difficult. But the cropped sub-images utilized for time-lapse processing are based on this detected radius which might be too small to account for the size of colonies on the late frames. Therefore, the detected radius can be scaled to match the later sizes.
The button Apply & Continue allows to fix the made changes and continue scaling (e.g. a different subset of colonies). Abort quits and does not save any changes. Save & Quit quits and saves changes.
The mini-GUI opened by the Scale detected radius button.
Main-EP
Additional possibilities
Apply spatial calibration factor to all frames applies the spatial calibration factor of the currently displayed frame to all other frames.
Apply area of interest to all frames applies the area of interest of the currently displayed frame to all other frames.
Apply both to all frames applies the spatial calibration factor and the the area of interest of the currently displayed frame to all other frames.
Remove linked and overlay folders removes all stored linked and overlay folders.
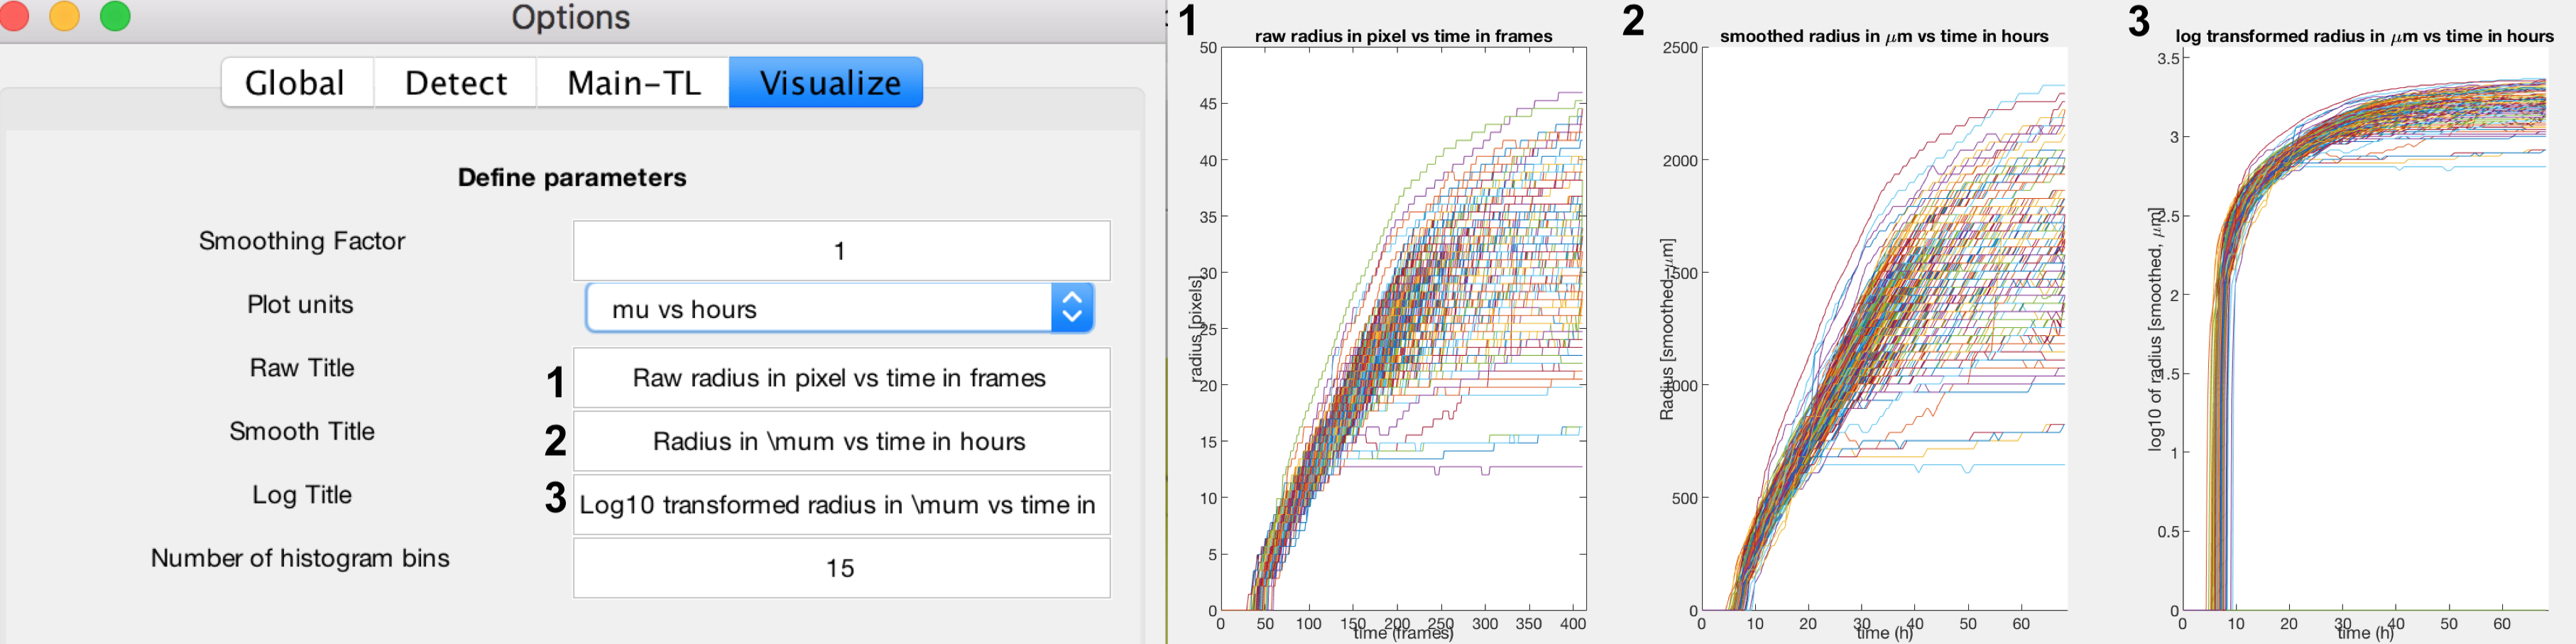
Visualize
After analyzing a time-lapse series, a quick visualization of the colony growth curves can be displayed by clicking on the Radius vs Time button of the Visualize tab of the main panel. In the Options the user may chose to plot these curves 1) in raw units: pixels/frame or 2) in more biologically meaninful units, i.e micrometers/time. A user may also chose 3) a log-y axis, as this could enable to visualize an exponential curve as a linear slope (typically if the first growth phase is macroscopically detectable, which is not the case in the following example.
Visualize tab of the Options and example of colony growth curves visualization
In addition, the user can chose to visualize the colony size distribution on a given (or multiple) frame(s) with an histogram. The parameter number of histogram bins can be inputted by the user.